Quantifying Eyewitness Confidence
I created a system to categorize witness confidence statements.
Note
Rather like my post on multilingual pretraining, this is also a writeup of old research. The paper finally got published this year, so this research finally gets its day in the sun.
Eyewitness Confidence
When a person is witness to a crime, that person is often involved in legal proceedings, especially if they can identify who committed the crime. Eyewitness testimony often plays a crucial role in trials, and compelling testimony can mean the difference between a person going to jail or going free. Because eyewitness testimony is so consequential, great care is taken to insure it is accurate and reliable.
Research has shown that witness's initial statements of confidence tend to be trustworthy. As time wears on, this trustworthiness declines. Memory is fleeting and subjective. People are very susceptible to priming effects, which means their memory can change based on things they're told. As a trial wears on, and the witness is being told by the prosecutor that the accused is guilty, this can warp the witness's confidence and lead to bad outcomes such as wrongful convictions. For this reason, courts tend to rely on a witness's original statement.
When an eyewitness gives a statement, they typically make an identification and give a report of how confident they are. Different jurisdictions collect this report differently. Some ask for a number between 1 and 10. Some ask for a number between 1 and 5. Some just ask for simple verbal confidence, "In your own words, how confident are you?" This makes it nearly impossible to compare the confidence of witnesses whose statements were taken in different places.
To rectify this issue, we create an AI-powered classifier that translates natural language statements of eyewitness confidence statements into one of three numerical bins: Low, Medium, and High confidence.
This work was done jointly with Rachel Greenspan, a law professor at Ole Miss and Paul Heaton, a professor at Penn.
The Data
For this project, we wanted to create a model that would faithfully map people's words to a numeric scale. In the eyewitness confidence literature, confidence is typically measured on a ternary scale, with categories of Low, Medium, and High. While there isn't complete consensus on how these ratings match up to numbers, we went with the accepted standard: Low = 0-25%, Medium = 25-75%, High = 75%-100%.
Training a model requires a bunch of data. Thankfully, some of my co-authors have connections and were able to get access to several studies' worth of data with which to train the classifier. While additional data was a blessing, it came with its own share of problems.
The Scale
The different studies asked people to rate their confidence both verbally and numerically. However, not all studies used the same scale. Some used an 11-point scale, (0 to 10) while others used a six-point scale (0-5). Another used a 0-100 scale. We had to translate all of these different scales into a 100 point scale, and then from there into our Low-Medium-High bins.
This caused problems. For example, someone using a six-point scale might have said for their verbal statement, "I am 75% sure it was him." Then, they would have had to translate that into a 0-10 scale. Should they choose a 7 or an 8? If they chose an 8, this would put them in the High bin, whereas a 7 would put them in the Medium bin. For this reason, several of our statements (especially ones on the border between bins) may not be in the bin their speaker would have intended.
Other Data Considerations
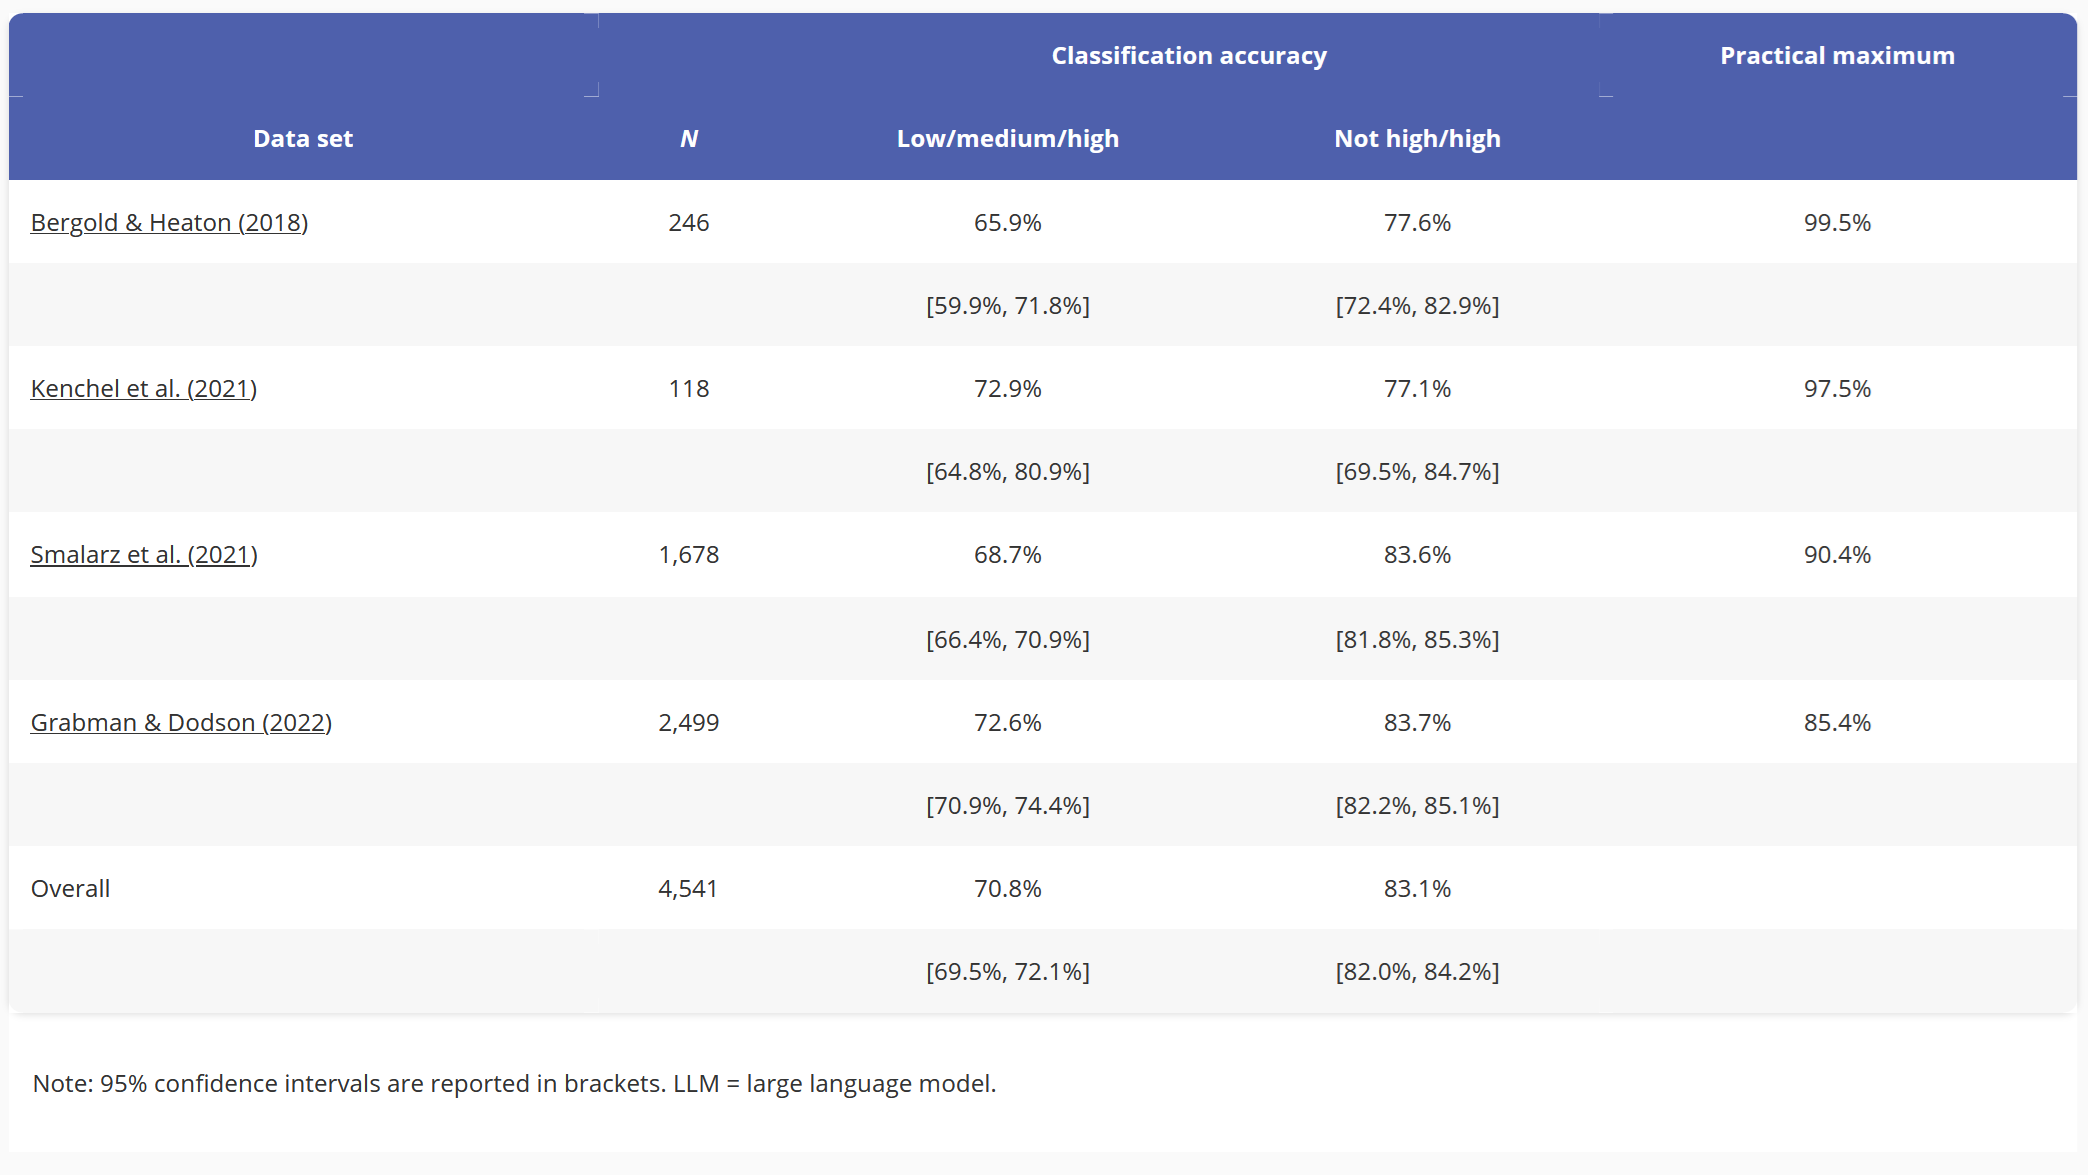
Another problem with the data is that different respondents used the same words to describe different numerical levels of confidence. When asked how confident they were, several people responded "Pretty Confident" with values of 8 or 9 on a 1 to 10 scale. Several others responded with the exact same "Pretty Confident", but gave values of 5 or 6 on a 1 to 10 scale. This meant that even if we had a perfect classifier, the human data was too noisy for it to get 100% accuracy. If half of all people who say "Pretty confident" had High confidence and half had Medium confidence, the classifier would be expected to get it wrong half of the time.
Methods
We collected data from several studies and used it to fine-tune RoBERTa, a masked language model. Previous work in automatic eyewitness confidence classification had used older machine learning methods like bag-of-words classifiers to tackle this problem. However, bag-of-words models cannot generalize to new inputs. Leveraging a pretrained language model, our classifier was able to generalize successfully to previously unseen inputs. We tested this by keeping results from one study hidden until we had this paper basically finished. Only then did we validate our classifier on this held-out study result. Because our model performed well on this, we knew the model was able to generalize to new data.
Results
We tested our classifier accuracy in two ways. First, using the full Low-Medium-High continuum. However, in the real world, it isn't super important if an eyewitness is kind of sure or not really sure. All we care about is if they have high confidence (valuable in a court of law) or not. (not valuable in a court of law) Because of this we also calculate High-Not High accuracy on all of the datasets.

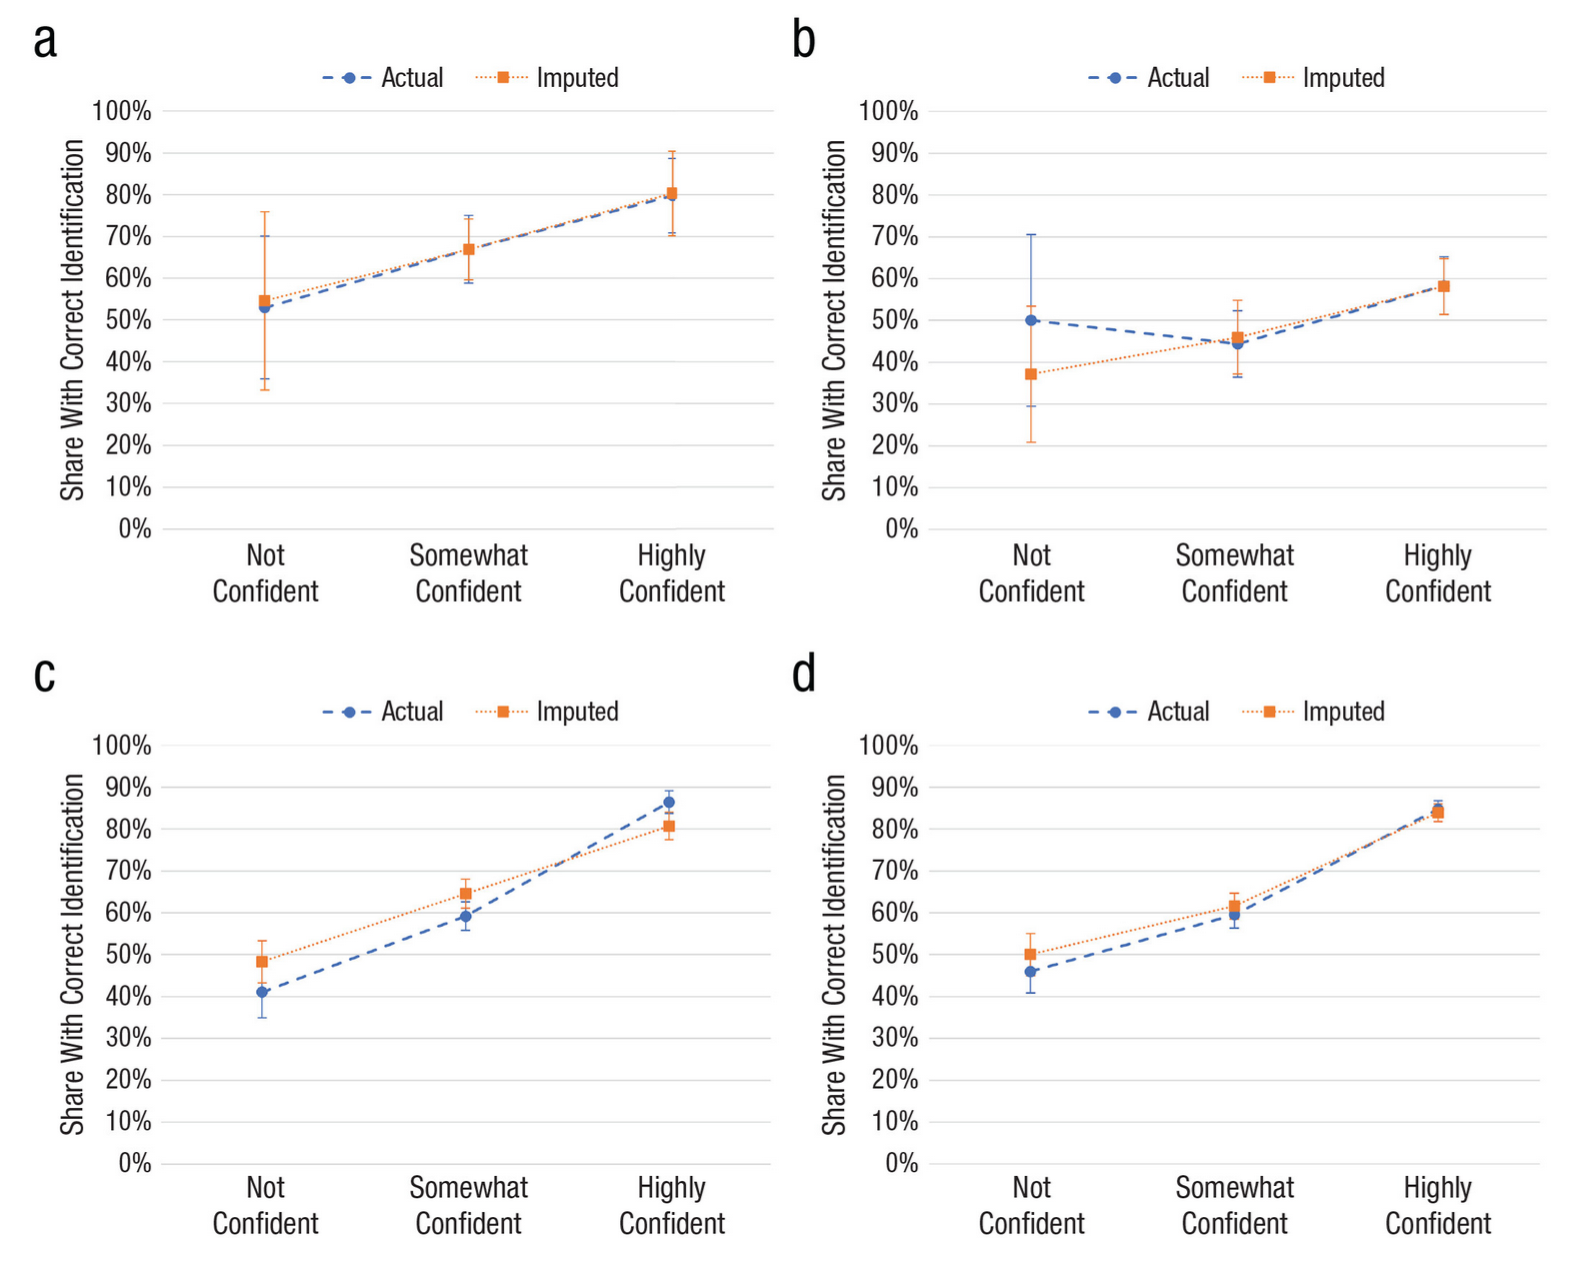
But this was just the tip of the iceberg. In the literature, there is a weak correlation between perceived accuracy (how well someone thinks they remember) and actual accuracy (did they remember correctly). We wanted to address whether our model captured this dynamic as well. Ideally, our model would be well-calibrated to the true human data, meaning that the human and classifier accuracies would match up.

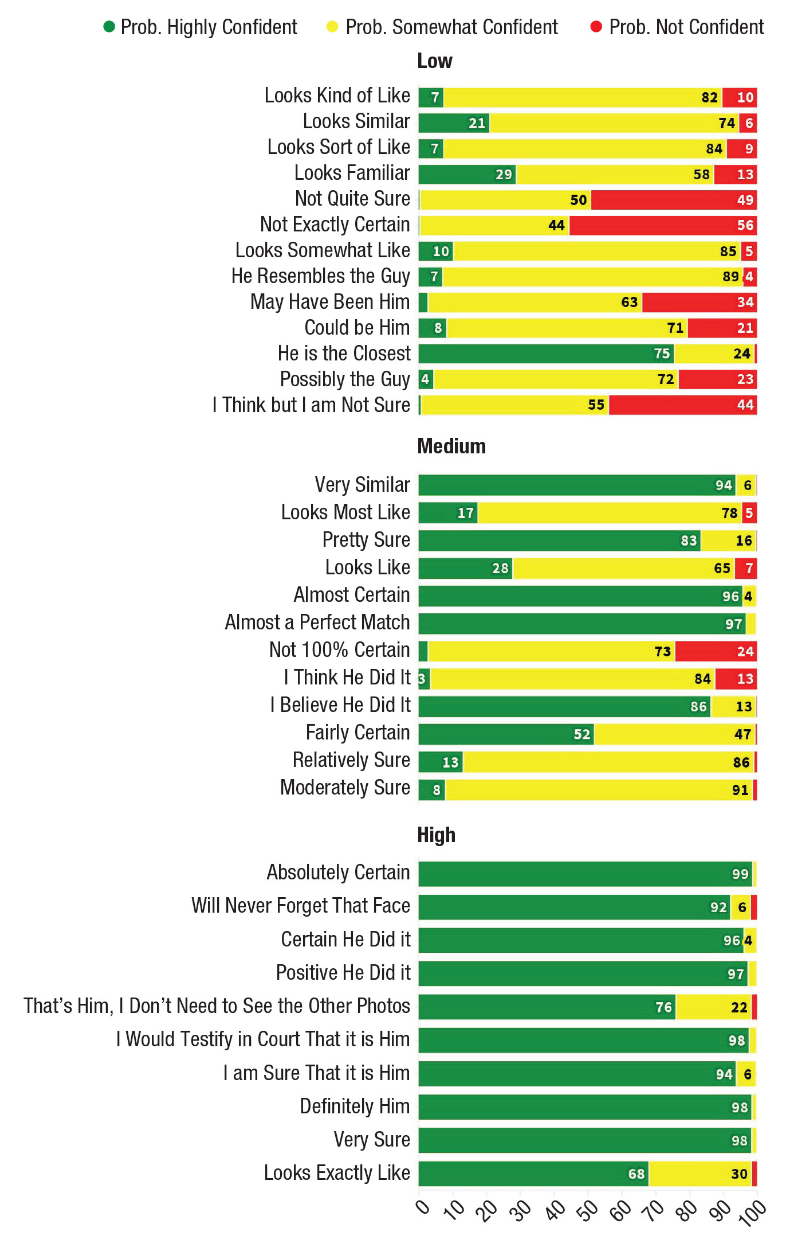
They did! One other interesting feature of our classifier model is that for each input, we get the classifier's probability that the input belonged to each class. That means we can see how 'sure' the classifier is for each statement.

We compare model predictions to human data from a 2005 study on confidence. While that study used a different scale for Low, Medium, and High, our classifier still matches reasonably well with these 20-year old statements.
Conclusion
This is just an overview of the paper. If you want to read the full text, there's an open-access version online. We presented it at the American Psychology-Law Society conference in 2023, and it was published in the journal Psychological Science. It was the first real research I had done where I alone was responsible for all of the computer science stuff, and I'm proud of how it turned out.