Semantic Map of the Bible
I plotted every verse of the Bible based on meaning
Mapping the Bible
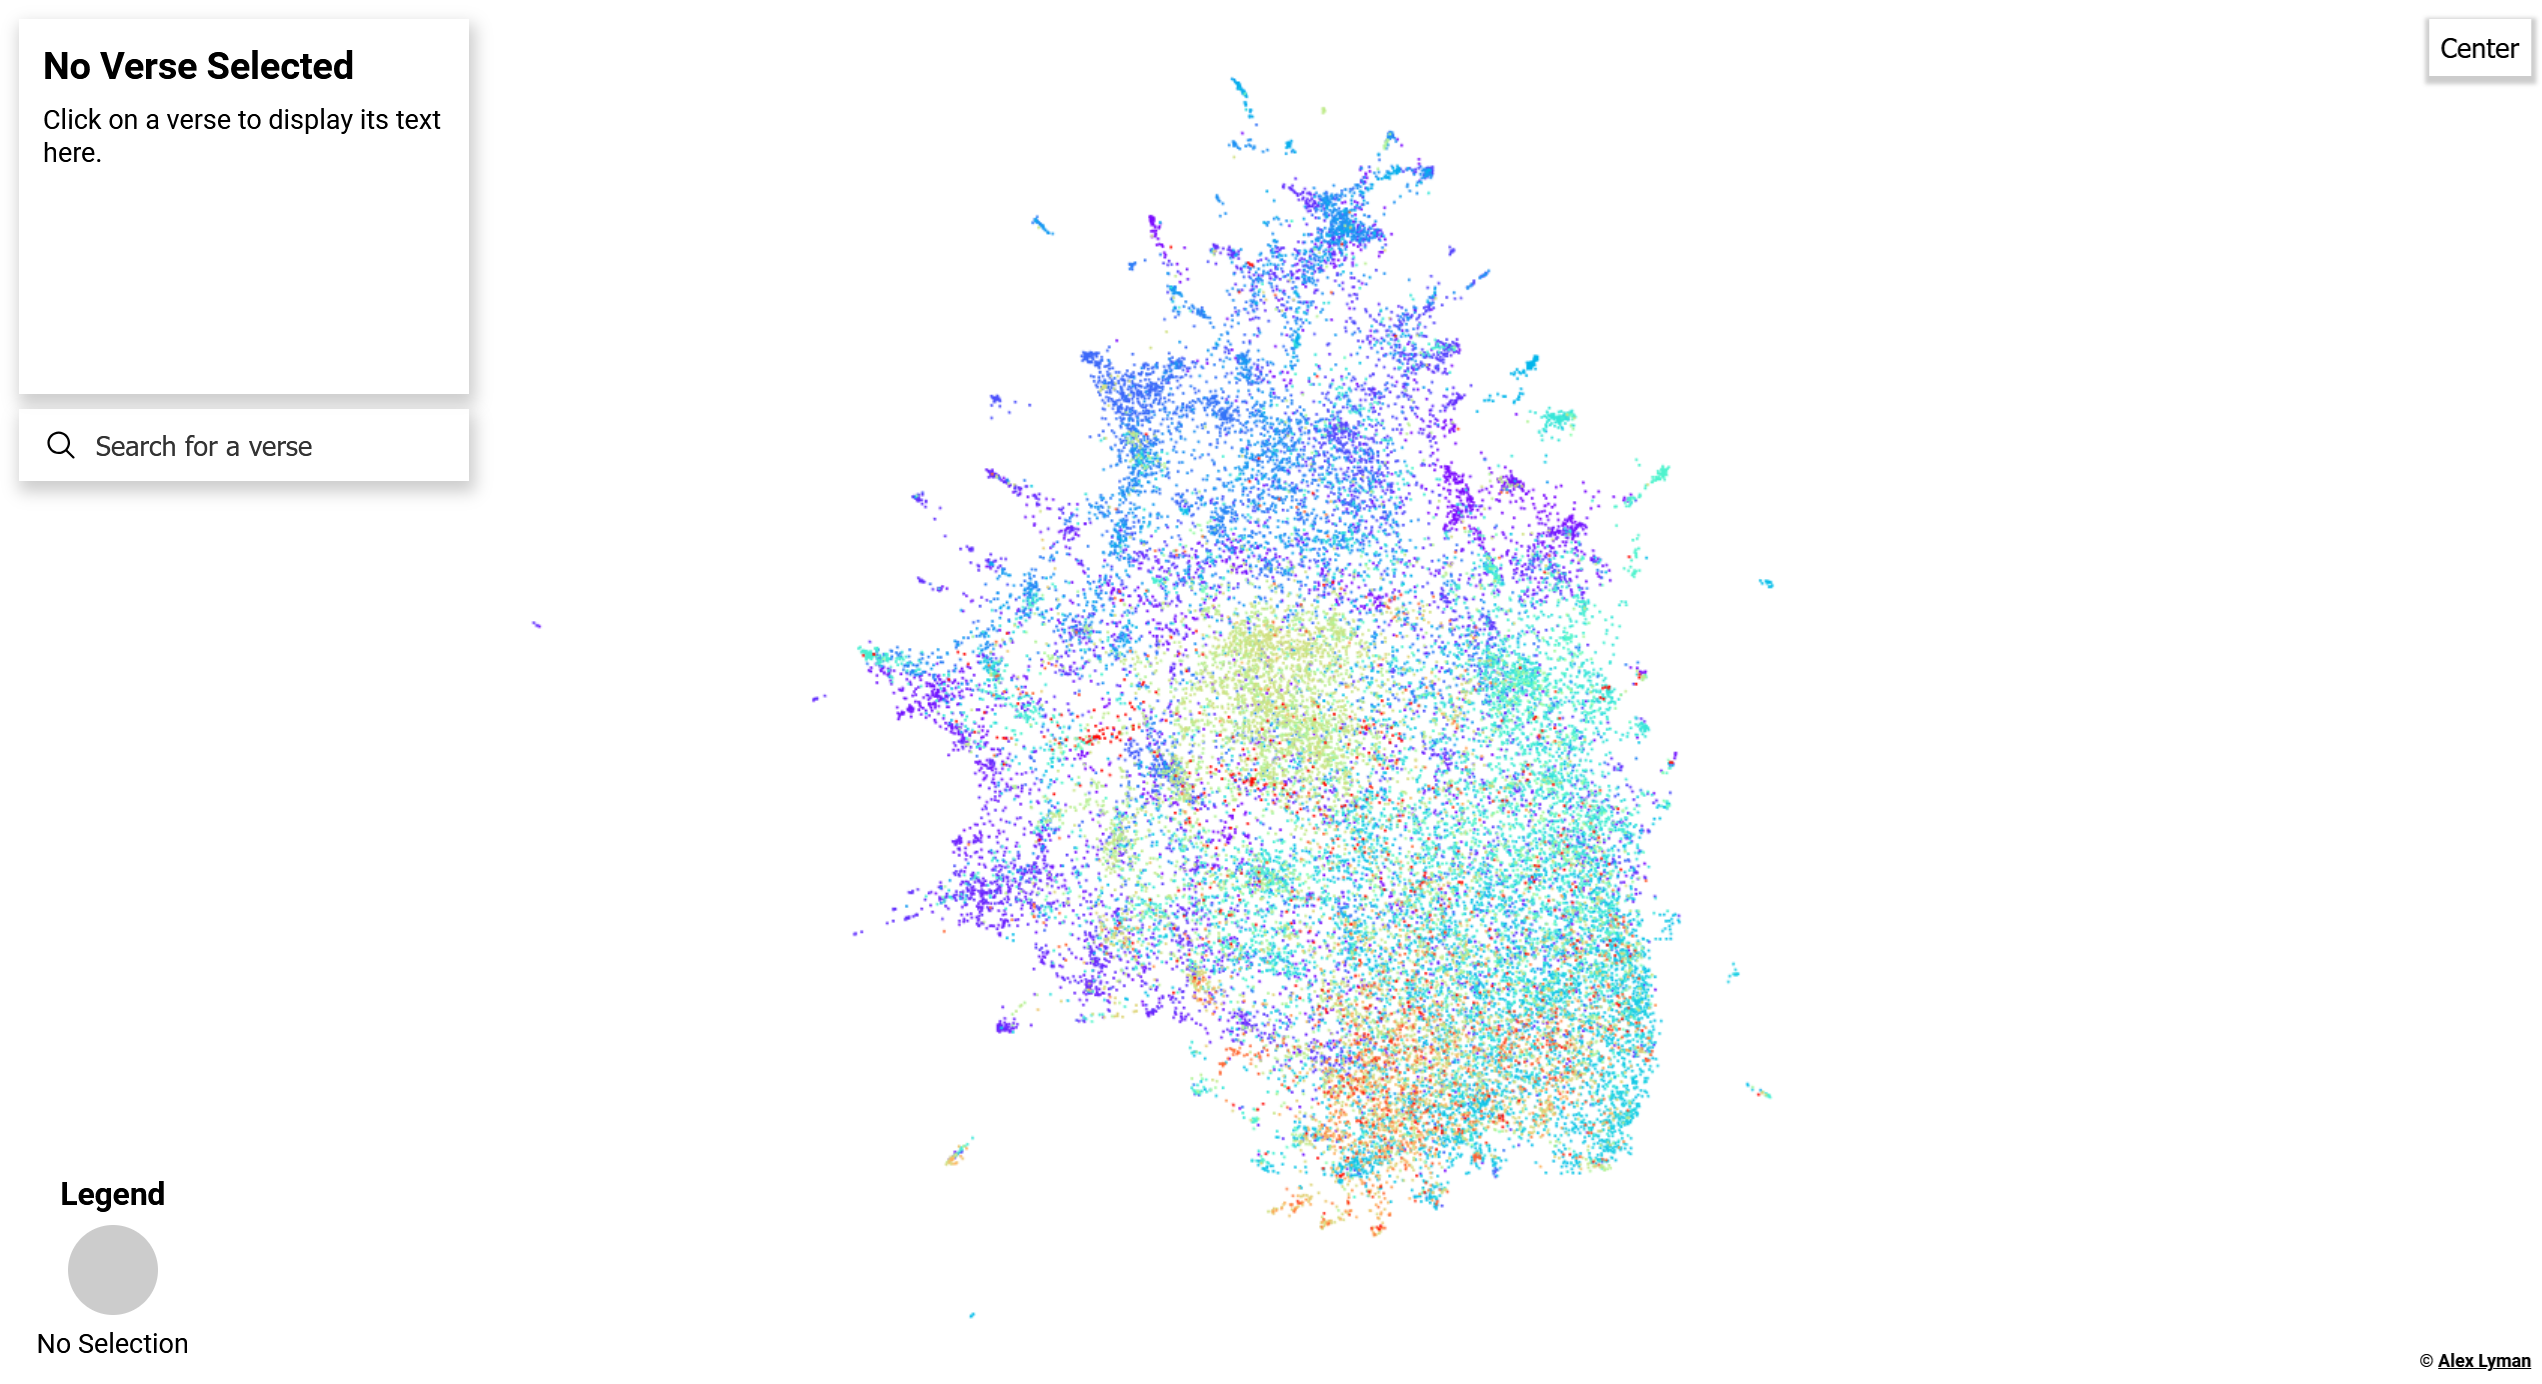
The Semantic Map of the Bible is a graph of every single verse in the King James Version of the Bible. Verses are plotted according to their semantic content (meaning). This means that verses about similar topics should be close to each other.
This tool allows for a novel approach to textual study, and is intended to allow the reader to explore the text and find new connections.
What is the Bible?
The Bible is widely considered the best-selling book of all time. It has had a profound influence on western and world culture. The Old Testament, or Hebrew Bible, is a collection of Jewish texts written between 1200 and 100 B.C.E. The New Testament was mostly written in the first century C.E. The Bible is considered a sacred text by Christians the world over. The King James Version of the Bible has been in circulation for over 400 years, and is still in wide use across the English-speaking world. It is broken up into chapters and verses for reference purposes.
How is the Plot Colored?
The graph is color-coded by Book in the Bible. Each book is a different shade, along the rainbow gradient you see below, starting with Genesis and ending in Revelation. The start of the New Testament is yellowish, with warmer colors for the rest of the Bible. This color scheme makes it easy to tell at a glance where in the Bible a verse is located.

How do I use the Plot?
The plot is designed to be simple to use. Click and drag to move the plot around, and zoom using the mouse wheel. Touch controls are supported, though the graph can be a bit laggy on mobile.
Click on any dot to see the reference, as well as the full text of the verse.
If you notice a cluster of verses, try clicking on several neighbors to see if you can figure out what they have in common.
This plot is designed to be explored, so dive in and see what you can find!
How was it Made?
Here's a brief summary. There's something called semantic embeddings, which are high-dimensional vectors that encode semantic meaning. (In layman's terms, they're like a fancy kind of number that has the same meaning as a word or phrase) Because these semantic embeddings have numeric value, we can use something called dimensionality reduction to plot the data on a graph. The process is simple. We use the encoder from a neural language model to transform each verse into a semantic embedding. Then, we use a dimensionality reduction algorithm to turn these embeddings into (x,y) coordinates which we can plot on a graph. We color the graph by text, and add in a few features to make it easy to use.